Summary
Hyperspectral Demonstration project objectives were to obtain and make available high spatial and spectral resolution imagery over varied mineral deposit types with typical BC ground conditions.
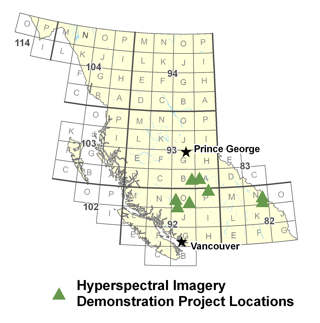
The hyperspectral imagery is available for free download and on-line analysis with the image analysis tools contained in the Exploration Assistant map through the Ministry of Energy Mines and Petroleum Resource's MapPlace (www.mapplace.ca). Ten images ranging in length from 4.2 to 18.7 km were collected over six sites: Blackdome, Gibraltar, Mt. Polley, Prosperity, Limonite (MINFILE occurrence) and the Lang Lake area. Terra Remote Sensing Inc. collected the imagery on August 1, 2007 for SpecTIR LLC using the AISA DUAL sensors. The spatial resolution of the imagery is 1.5 meters. Spectral resolution ranges from 0.9 nm to 12.6 nm and covers the electromagnetic spectrum from 0.967 -- 2.45 micromeres, providing 178 bands of information. This collection provides about 20.5 million individual spectrum.
This hyperspectral imagery is available in either radiance or reflectance values. SpecTIR performed the atmospheric correction utilizing in-house techniques based on the ATCOR4 program. An orthorectification solution is included with each download package.
On-line analysis is available with the Image Analysis Toolbox suite of programs included in the Exploration Assistant map on the MapPlace. The hyperspectral imagery has been added to the collection of Landsat and ASTER images available for analysis through this site. As part of the project two spectral libraries, the USGS Mineral Spectral Library and the John Hopkins University Mineral Spectral Library have been integrated into the site. Spectral Angle Mapper analysis utilizing library spectrum or image spectrum is now available for both ASTER and hyperspectral imagery. A spectrum plotting feature has been added to allow plotting of library or image spectrum for various wavelength ranges and sampled to match ASTER or hyperspectral band configurations.